HEY, How you doin ?

Expressing emotions occurs on a daily basis with different levels of intensity. However, these emotions are hidden and the source of emotion can only be described by the ‘owner’. For example, if 2 people meet for the first time, how can their feelings towards each other be visually expressed? Hence, we classify emotions as our hidden data.
During our group discussions we reflected on various scenarios in our daily lives where one could potentially display an emotion that is contrary to what they actually feel.
To solidify our idea, a team member shared a concept about the 7 Ground Emotions by Dr. Paul Ekmann where he proposed the seven basic emotions as contempt, anger, surprise, disgust, enjoyment, fear, and sadness.
While there are differing views among experts, most emotion scientists agree that there are at least five core emotions. Dr. Ekman’s research shows the strongest evidence to date of seven universal facial expressions of emotions.
Tracking Process
We presented our tracking process by gathering our emotions (our hidden data) we felt during the day for a week. Each day of the week (Mon-Sun) we witnessed our emotions and noted them down. Then we classified them within the 7 basic emotions. Finally, each member created a visual representation of their emotional summary for that day.
At the end of the week, we shared our visual representations and noticed some similarities. This includes:
• Emotion
• Intensity of the emotion
• Visualize emotion by a specific colour
Another similarity we identified was, if an emotion was not felt during the day then that colour is not included. Generally, the day of the week was shown by overall structure, order or distance between elements.
PHYSICALIZATION OF HIDDEN DATA
Nourhen
I represent the days of the week as Bubbles and inside each one of them there are Spirals, those Spirals are the 7 emotions. for example the blue Spiral represent
Happiness the black one is Sadness , and the size of the Spiral means the intensity of that feeling e.g. the size of the blue Spiral in the first bubble is bigger than the blue one in the next bubble and that means that I was Happier at the first day than the second day. and I have regrouped the secondary emotions and classified them in those 7 emotions, for example the feeling of Accomplishment, Gratitude, Optimism belong to Happiness, and I have represent those secondary emotions with points on the Spirals and the number of the points is the intensity of that feeling. e.g. the red points on the blue Spiral in the first bubble means I feel peace.
Christiana
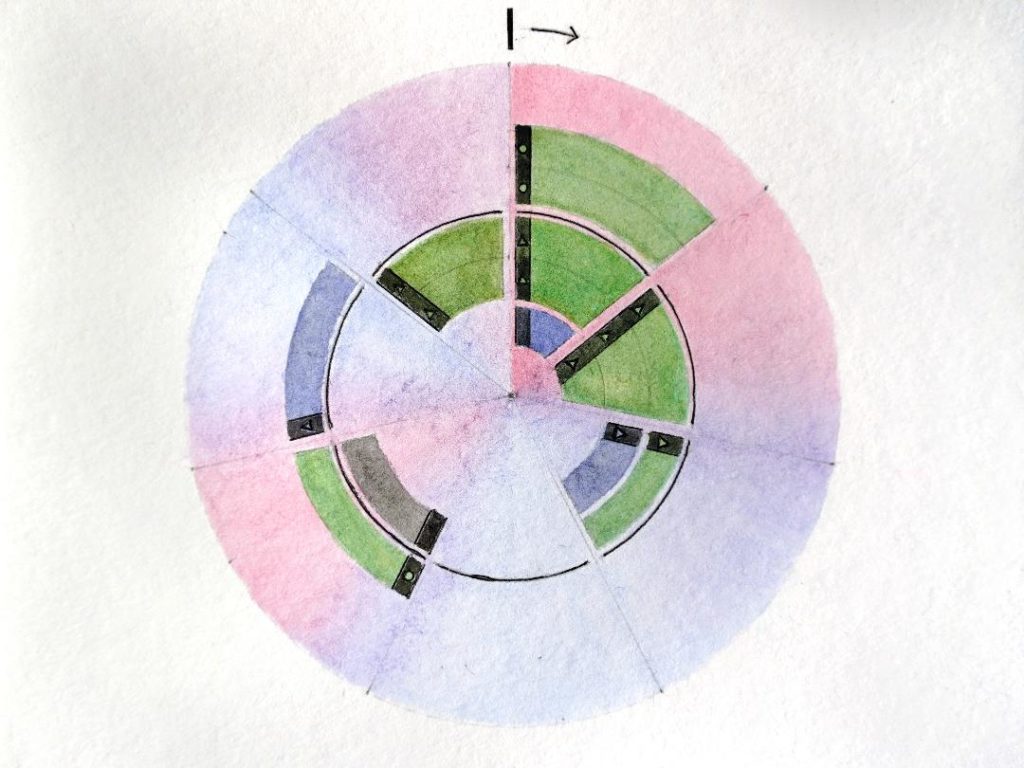
My week of 7 ground emotions are captured in 6 hours intervals of a day for 7 days. The numbers represent the 7 days with each column showing a full day. Some blocks were filled with a single emotion and others were a mixture of emotions. The red squared columns are days I spent outdoors and with the blue ones I spent completely indoors.
Ghazi
In my try of physicalisation of the emotions ,I did choose the columns as the days and the rows as the hours of each day. I have tried to represent the flow of the emotions with the help of activities being done at the moment .So the majority of activities being done during the day are labeled with their specific colour. And the emotions are that line in the middle of each case and when he is going straight so the emotions are neutral or very weak but the more bouncy it is so are the emotions being detected more intense.
Laura


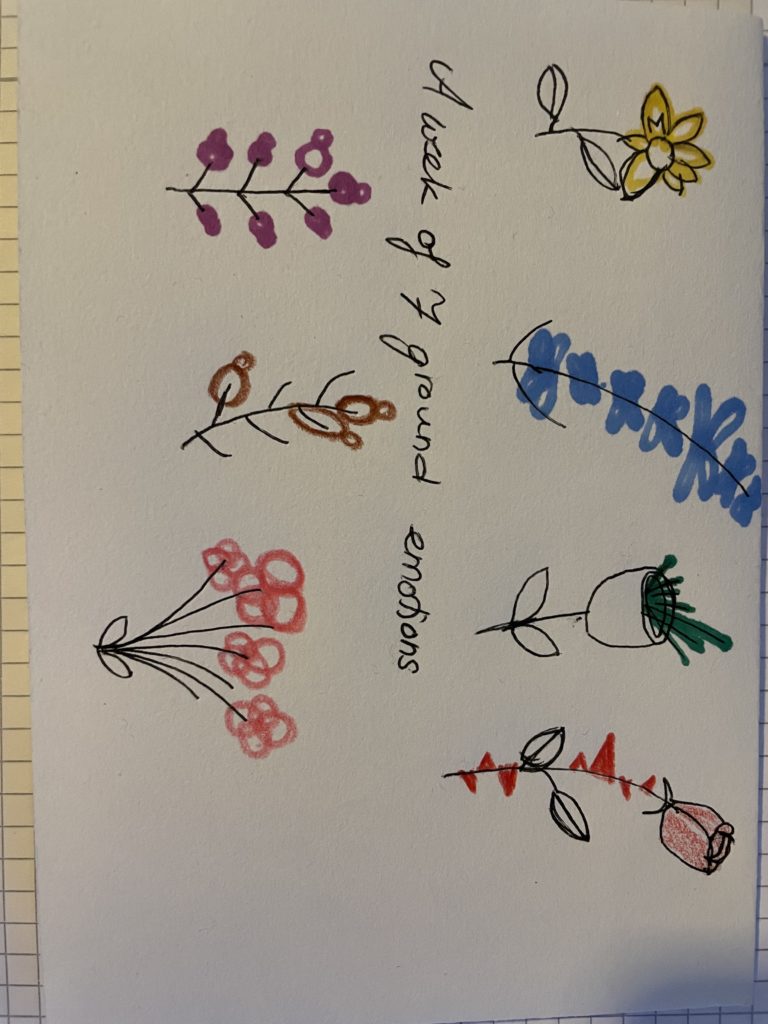
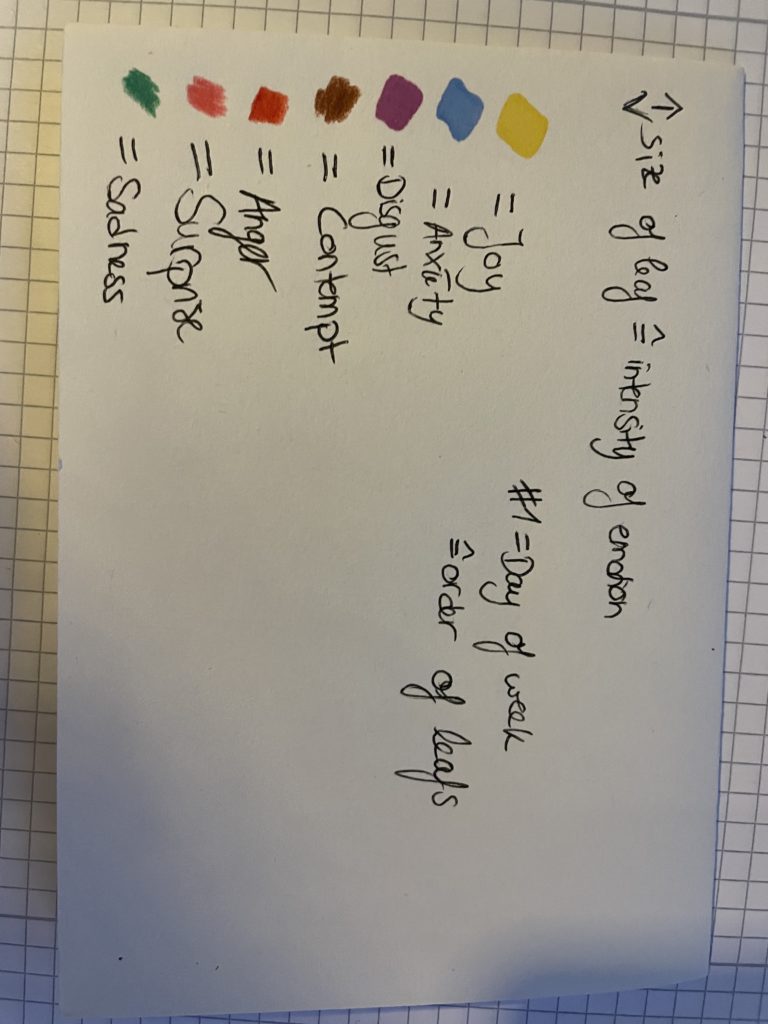
In my attempt to visualize my emotions I tried to represent every emotion by a different flower and their own colour. The size of the leaf or thorn of the flower represents the intensity of the emotion I felt on each day. If a flower doesn’t have a leaf on one of the seven days, it means I didn’t feel that emotion on that specific day. The small “M” on each flower stands for Monday and the days can be mapped to the emotions by either looking at one flower from left to right or clockwise.
As a result of that, Happiness was for me intuitively connected to a yellow sunflower. Anger, however, felt best symbolised by a red rose, where every thorn shall represent the amount of Anger I felt on a specific day.
Other team – Postcards received(Team 5)
Data physicalisation can be interpreted differently based on perspective and understanding of what the hidden data means. In the end, our initial interpretation was quite different from the actual meanings behind the postcard.


