Gross concept
After working with our collected hidden data in our visualizations and haptification, we realized that we needed to reduce the number of variables in our physicalization, in order to obtain a clearer representation. We considered it would be better to overload one of them (using multiple encodings for stress, for example) rather than attempting to have many different dimensions. Especially if we wanted this to be an object that is easy to use and fast to understand, given a “daily-work” scenario. But what does this “work” scenario look like? Although we all may experience the changing weight of workload, stress and motivation, the use case scenarios for their data physicalization may vary greatly for each person. This is why we chose to develop a modular design, which could adapt to different team constellations and could work either as an input or output of data. As an example, we had these three different scenarios in mind:
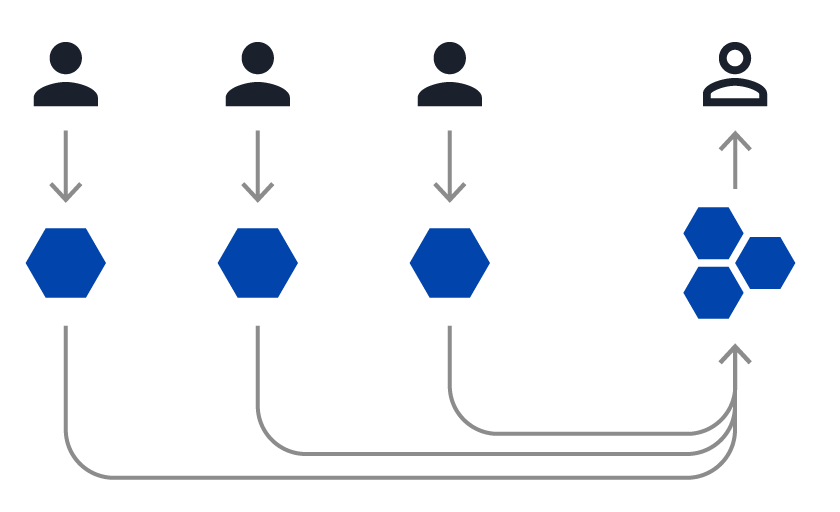
Scenario 1: Remotely located employees have a physicalization where they input data. The device reads it and sends it to the supervisor. The supervisor has a physicalization that shows his team’s efforts and stress.
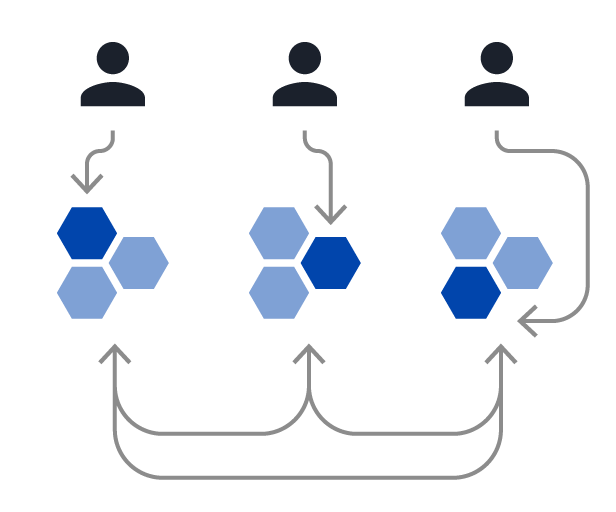
Scenario 2: All employees have a physicalization where they input data. At the same time, they are able to visualize the input of others.

Scenario 3: In a collocated team, each employee inputs their data into one “part” of a single physicalization, which is visible to the whole team or even clients (e.g. in a restaurant, to show customers that this may affect service times).
Our data physicalization would then show the data of one person, but put together with colleagues physicalization, it would depict how the team is faring with its workload. For example, if there are gross differences in the amount of tasks or stress levels, it would give the team or a supervisor the chance to correct unwanted imbalances.
Encoding
To simplify the amount of data encoded, we decided to make a design that would work with two variables: an “objective” workload variable and a subjective stress variable. At first we imagined it could be more or less automated, using for example a work ticket system. This however, is not applicable to all work scenarios and even such systems count on a subjective perception of the work entailed; hence the quote marks. For the stress, we considered the users would input the data themselves, based on their self-awareness.
With this in mind, we developed a design for the module. A prism which could “shape-shift”, to display this data:
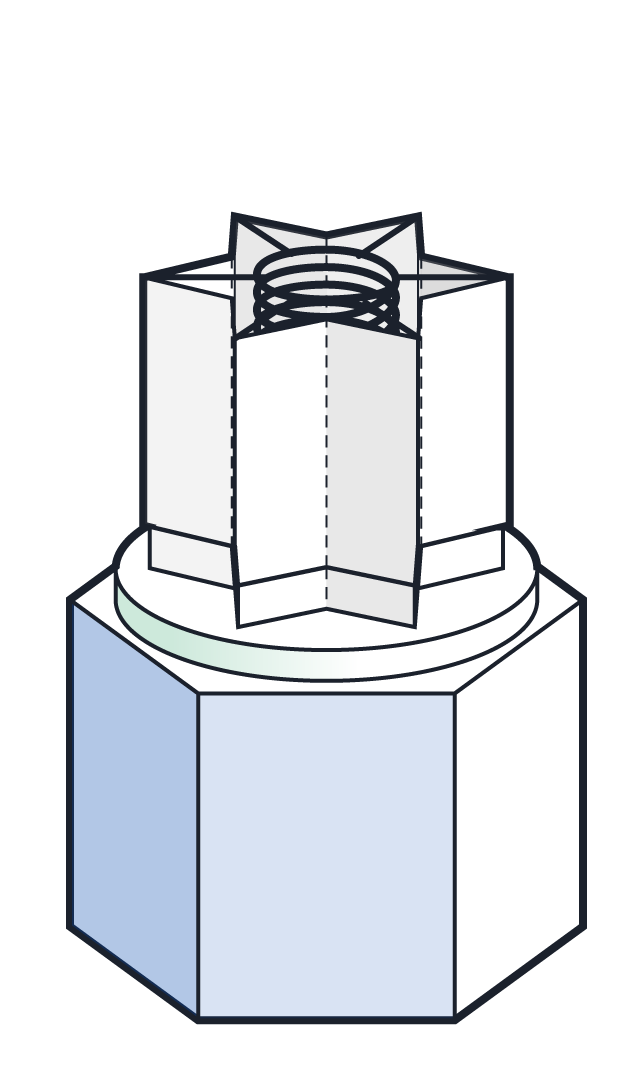
- A change in the base shape and color encodes the users’ perceived capacity (visual feedback). The shape could go from a “relaxed” hexagon in a cool color, to a “tight” sharp star, in a red, warning color.
- A change in height and spring tension shows the workload (haptic feedback from pressure and visual height). A more compressed shape and spring, reflects more tension and less capacity to add on more weight (both physical and metaphorical).
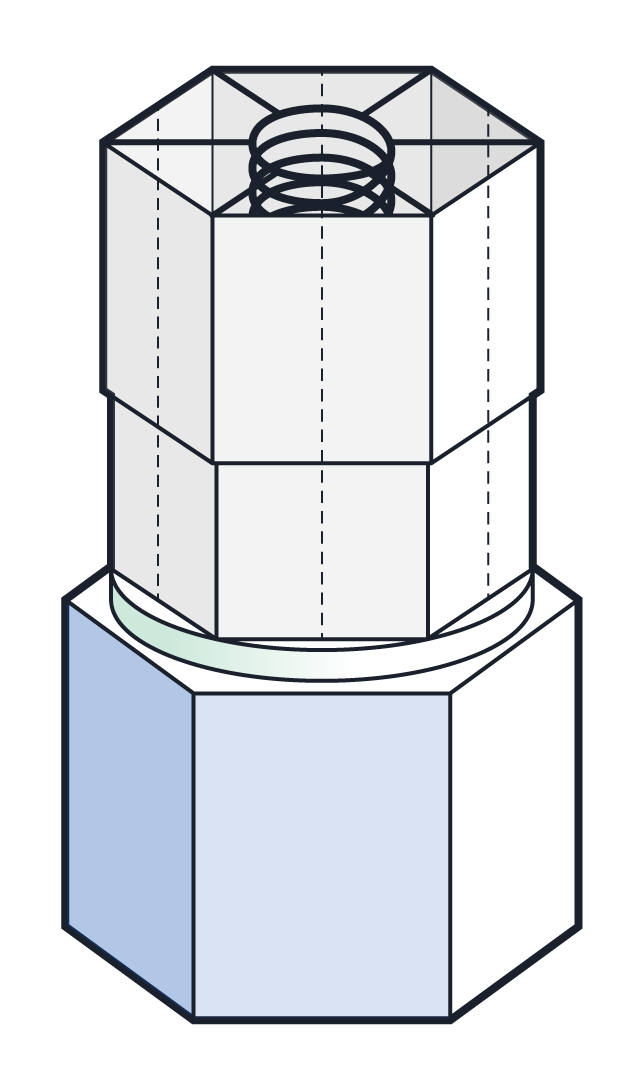
Fig. 3.1: Design sketches for the module

All changes occur in a continuous scale, to encode what we interpreted as a non-discrete range in the data.
Technical development
Before starting with the real technical development decisions needed to be made on what components and Microcontroller or single-board-computer, would work best for us. The latter being the main component needed to be found first because all additional components would be dependent on the decision. Moreover we already had some component ideas and a budget that is an additional constraint. For example, a working load cell is important to us.
The decision was made easy by the possibility of borrowing an Arduino Uno, including a whole starter kit to start tinkering with additional components.
Fig. 3.2: Arduino UNO Kit
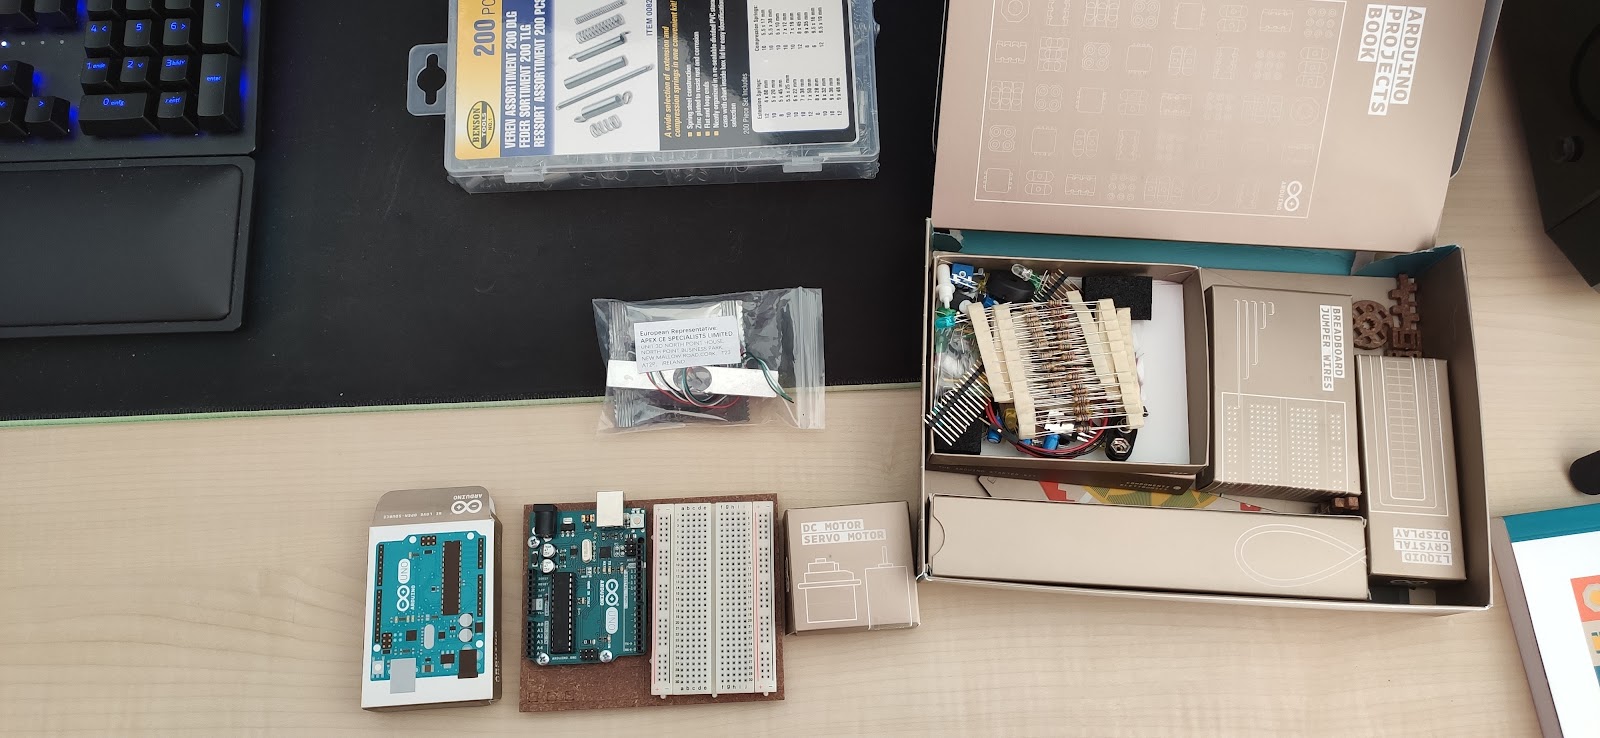
The Arduino Uno is a single-board-microcontroller based on the “ATmega328P” chip and the board is equipped with many digital and analog input / output pins that make it easy to interface. For power delivery and direct connection to the Arduino IDE a USB B to USB A cable is used. All these properties make it easy to test components, develop and write source code for our project. Included with the board were additional items like: a breadboard, servo motors, cables, resistors and many non essential items.
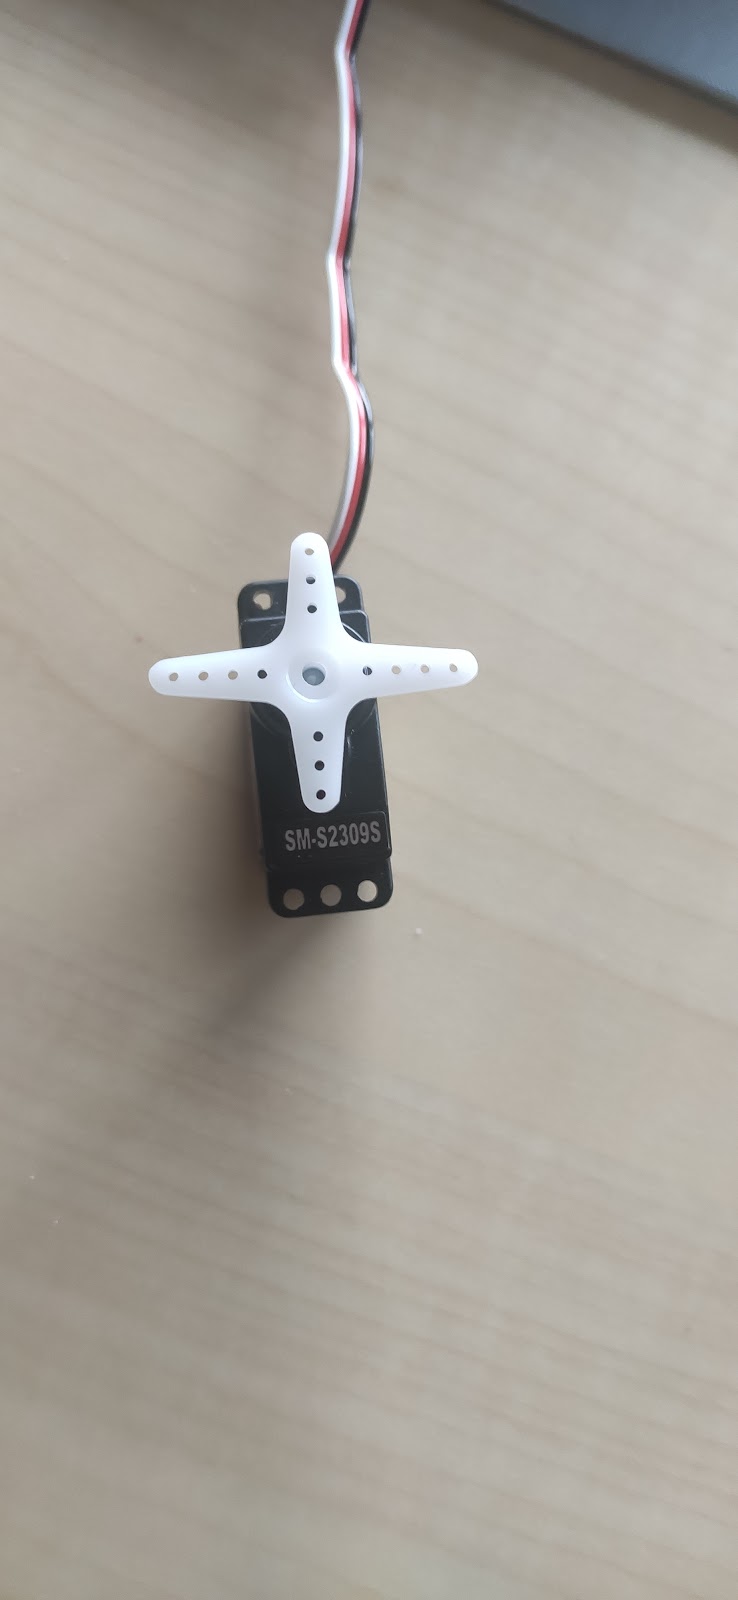
Fig. 3.3: Components. Left: Servo Motor. Right: Connection to the microcontroller.

As already mentioned above, a component we wanted to work with from the start was a load cell. Normally a cell like that is used to make accurate weight measurements. For us that exact purpose was not essential but it could enable us to add a haptic component to our prototype.
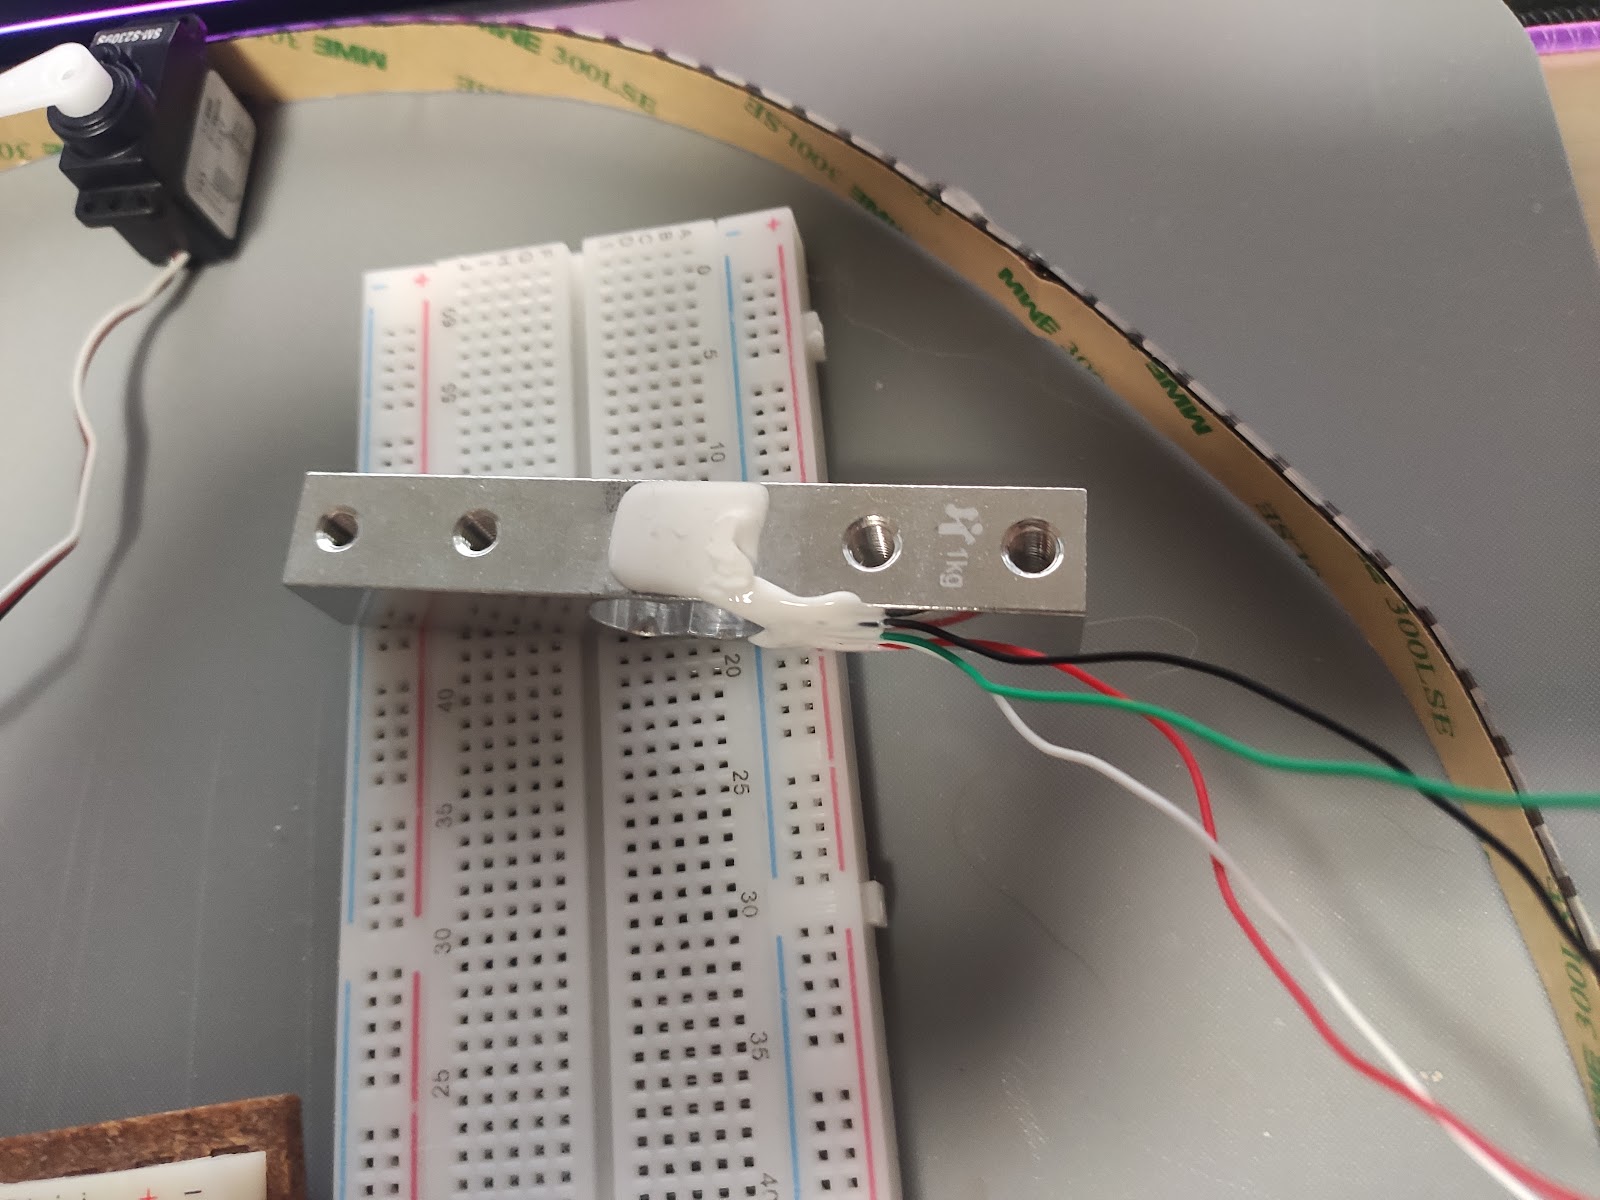
Fig. 3.4: Load Cell. Top: Diagram of working forces. Bottom: Connected component.
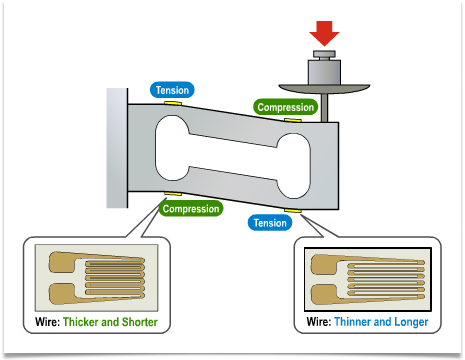
Because a load cell is not a trivial or generally known component, a short explanation of its functionality is in place.
A load cell converts a force such as tension, compression, pressure, or torque into an electrical signal that can be measured and standardized. As the force applied to the load cell increases, the electrical signal changes proportionally. More specifically our load cell is a strain gauge load cell. For the conversion / measurement a very fine wire, or foil, set up in a grid pattern and attached to a flexible backing. When the shape of the strain gauge is altered, a change in its electrical resistance occurs. The wire or foil in the strain gauge is arranged in a way that, when force is applied in one direction, a linear change in resistance results. A load cell alone is not sufficient to interface with an arduino; a converter is needed because the signal from the load cell is analog and for easy interfacing with the arduino a digital signal is needed.
Fig. 3.5: Connected HX711 Converter
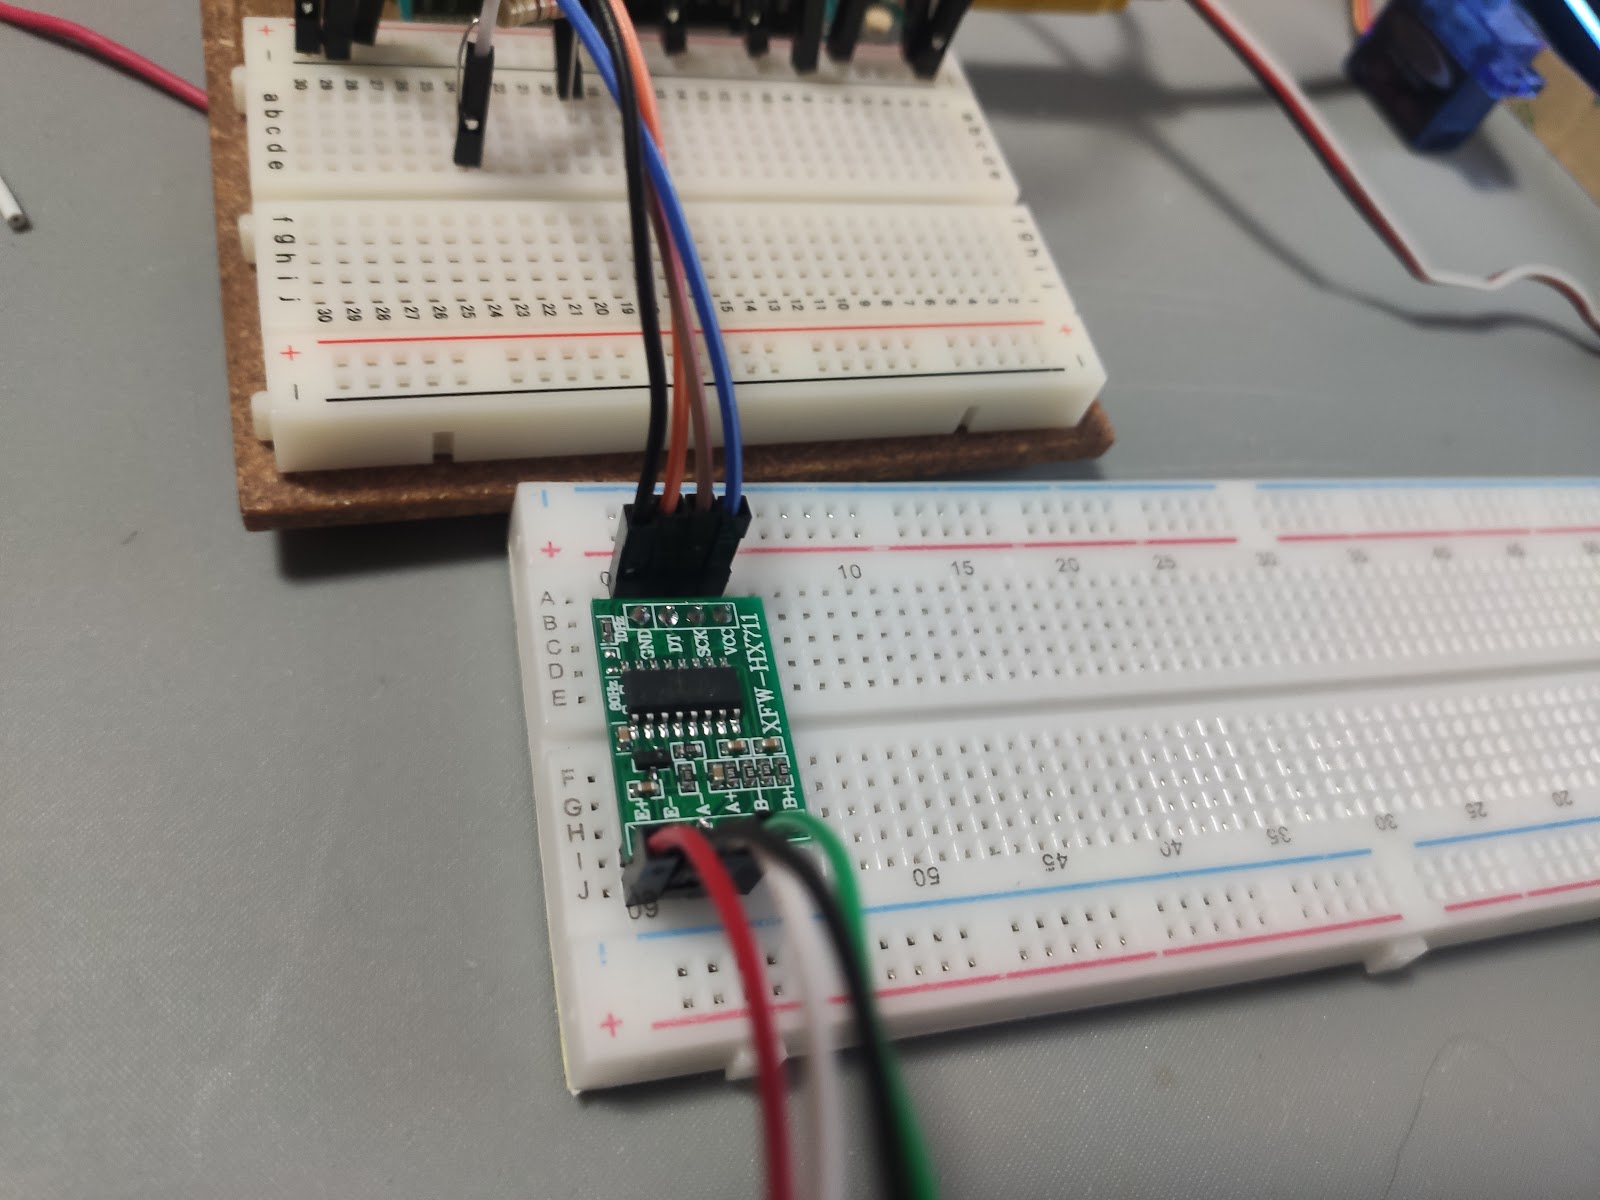
For that purpose the load cell was acquired in pair with the HX711 24-Bit Analog-to Digital
Converter. Correctly wired up that component makes it easy to use the load cell with a corresponding library.
Fig. 3.6: Connected LED strip
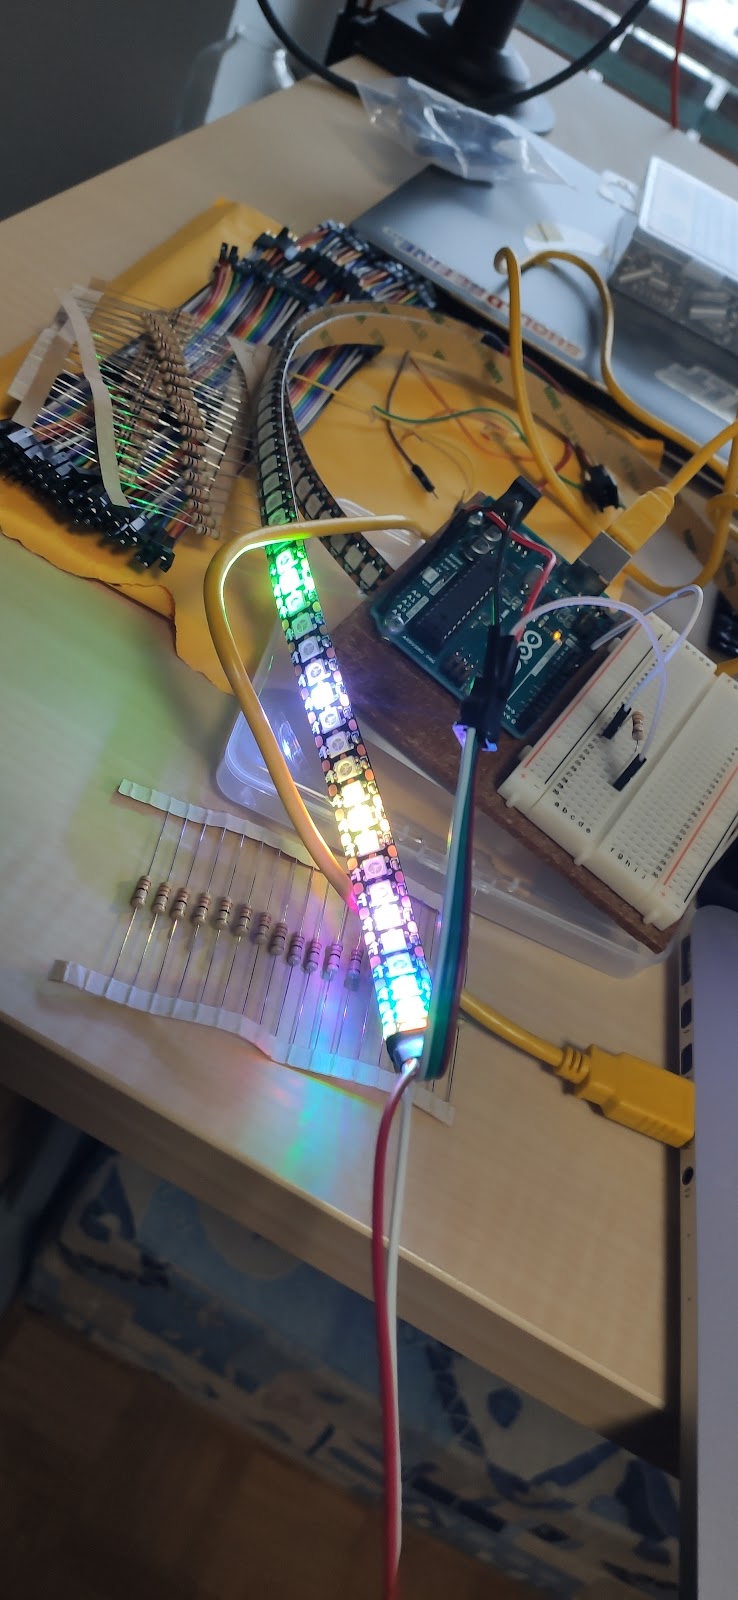
The last essential hardware component would be the led strip we used. The acquired led strip is a simple 5 V WS2812B RGB led strip. With the right library it is very easy to set this up and set an accurate red, green and blue value for each diode. For all development for the Arduino to control the components and represent the needed behavior the Arduino IDE was used. Inside the IDE one can syntax check and upload the code directly to the Arduino for it to be executed. Another important functionality is the serial terminal integrated in the IDE. With it one can get direct interaction with the device during runtime.
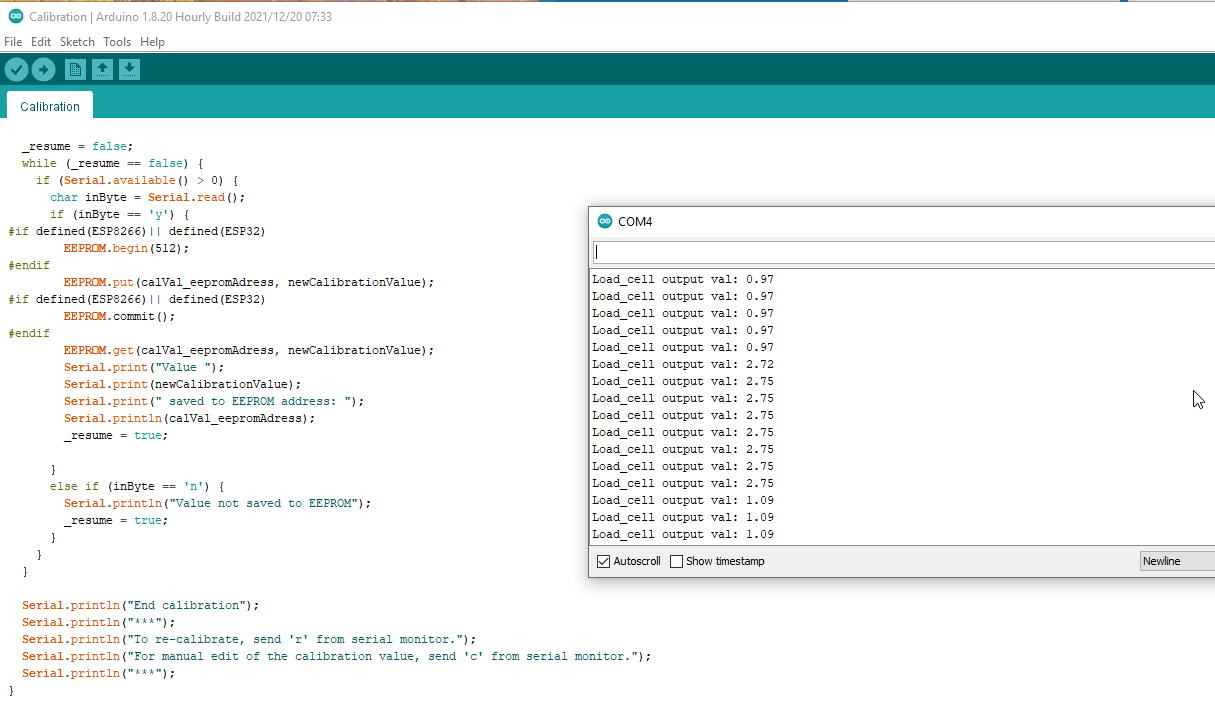
This is also used to interact with the load cell to execute the needed calibration as seen in the pictures below (figures 3.7 and 3.8).
Fig. 3.7: Logged output during calibration of the load cell

Fig. 3.7: Screenshot of code and output during runtime
Design development

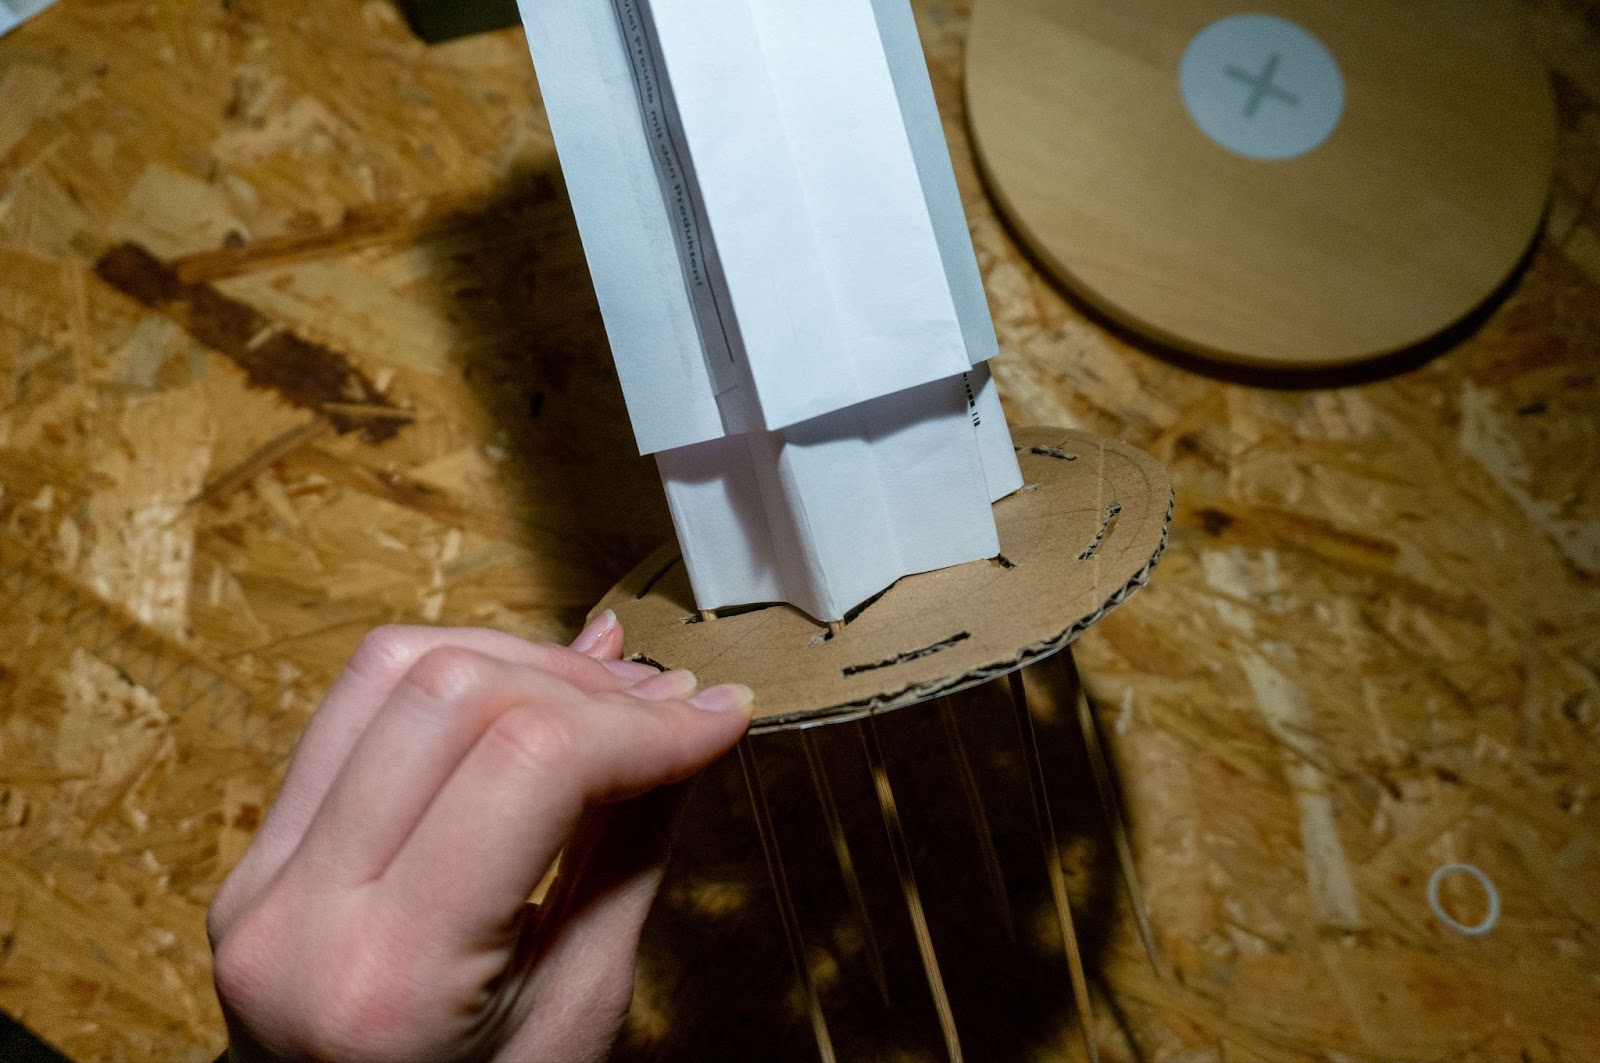
Fig. 3.8: Images of paper prototypes, for shape exploration.


For the shape of our physicalization, we first developed paper prototypes to get the feel of how we could achieve the shape-shifting effect. Inspired by the iris of camera lenses, we designed our own mechanics to achieve our desired “hexagon-to-star” change. We 3D-printed each part with PLA (in figure 4, the white parts) and PET-G (black parts). After some tests and breakages, we replaced thin connectors with metal screws and nuts that could better withstand the forces during manipulation.

Fig. 3.9: Final mechanic parts for the prototype.


To build the actual prism, we used brass profiles of 2mm and 3mm for the edges, and sewed fabric around it to get the faces. As the mechanism is rotated, the points where the edges are anchored move in and out, changing the shape of our prism base from hexagon to star, and vice versa.
Merging the work
For the final stage of development, we put together the mechanical object to the electronics.
Due to the limited time we had to develop the prototype and different challenges that presented to us along the way, some simplifications and modifications had to be done to our initial plan. Our plan introduced too many variables and components in a single object, that would certainly make the production of a first working prototype overly complicated, if not impossible.
One of the major changes was limiting the data display to a single dimension, removing the change in height and using a spring. Instead, we focus on automating the rotating mechanism with the servo motor and using the LEDs to accentuate the changes in shape, according to the input.
To keep our work with the load cell and the concept of expressing stress through physical pressure, we used the component as a controller for the user to input the data. The harder the person presses on the load cell, the tighter the shape gets, and lights up red. Else, it sheds a bluish light.
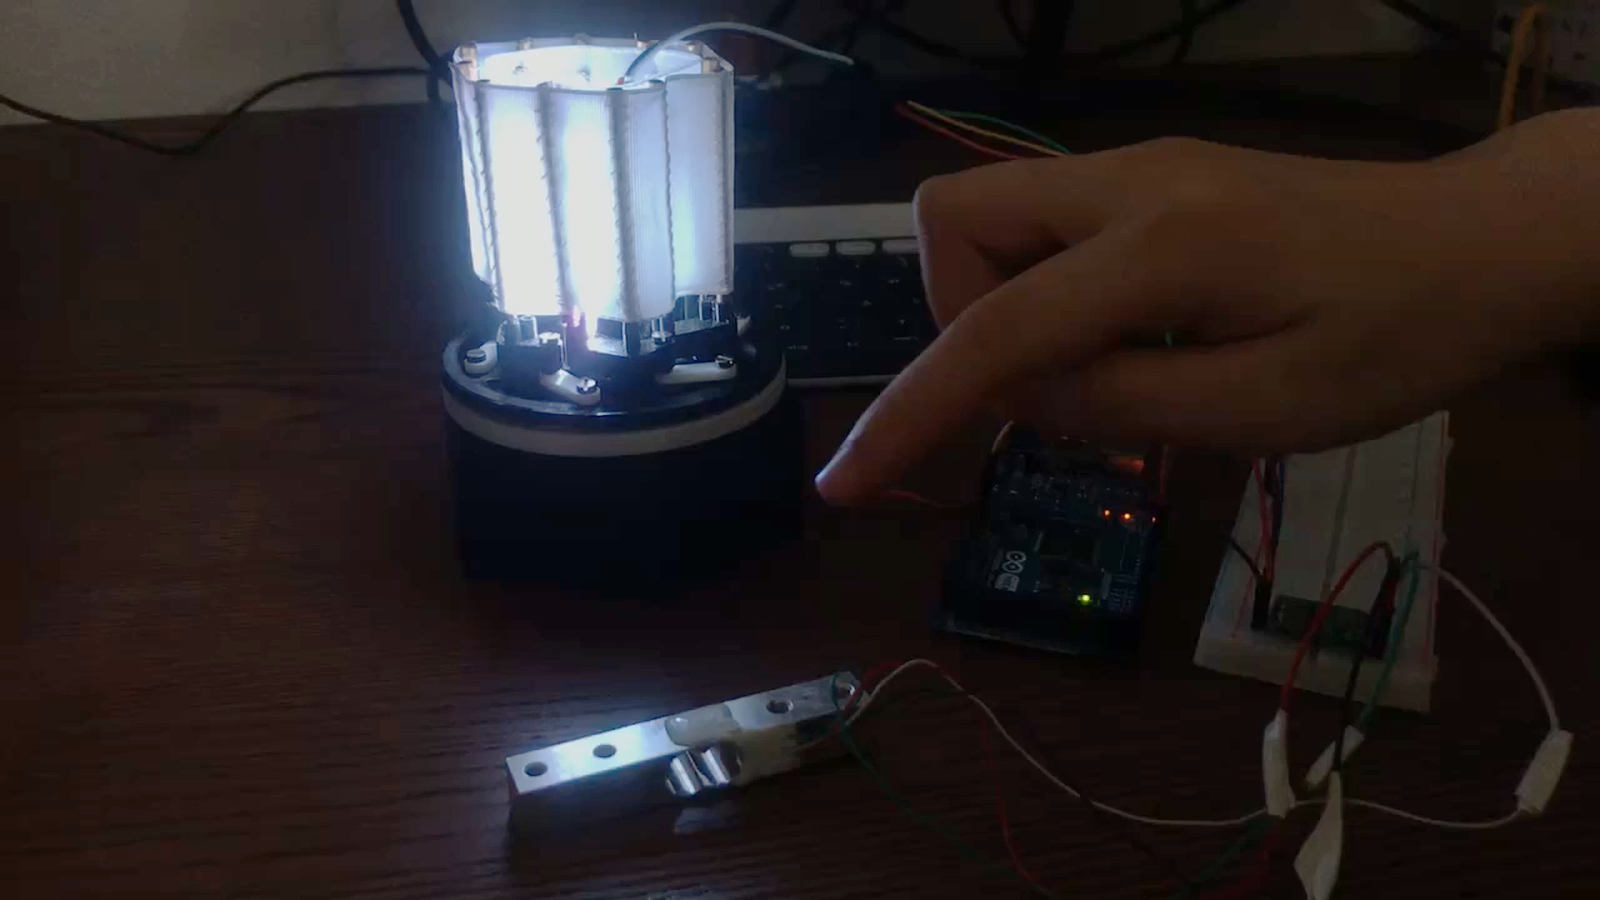
In figure 3.10, you can see the final prototype in its two stages: from relaxed to compressed, and the load cell as input.
Fig. 3.10: Functioning prototype: from relaxed to stressed.

Feedback / User Studies
To get feedback on our device, we designed an interview with various questions to fit the online interviewing format.
The interview included different categories of questions. First, we had introductory questions about their stress levels and whether their colleagues or supervisors are aware of them. Second, we had demographic questions about their age group and the work field. After that, we introduced the product and explained how the input and output worked.
Next, we asked about their opinion of the idea itself, whether they found having their stress data visualized is interesting or not. Following, we asked ethics related questions; whether they are comfortable or not with their supervisor / colleagues having access to that data. Finally, we showed the participants a video of the prototype and explained how it worked. We asked them to imagine themselves using it and then some usability questions, e.g. whether the system was complex or easy to use. To conclude, we ask for any additional feedback or any extra features that they think could improve the device.
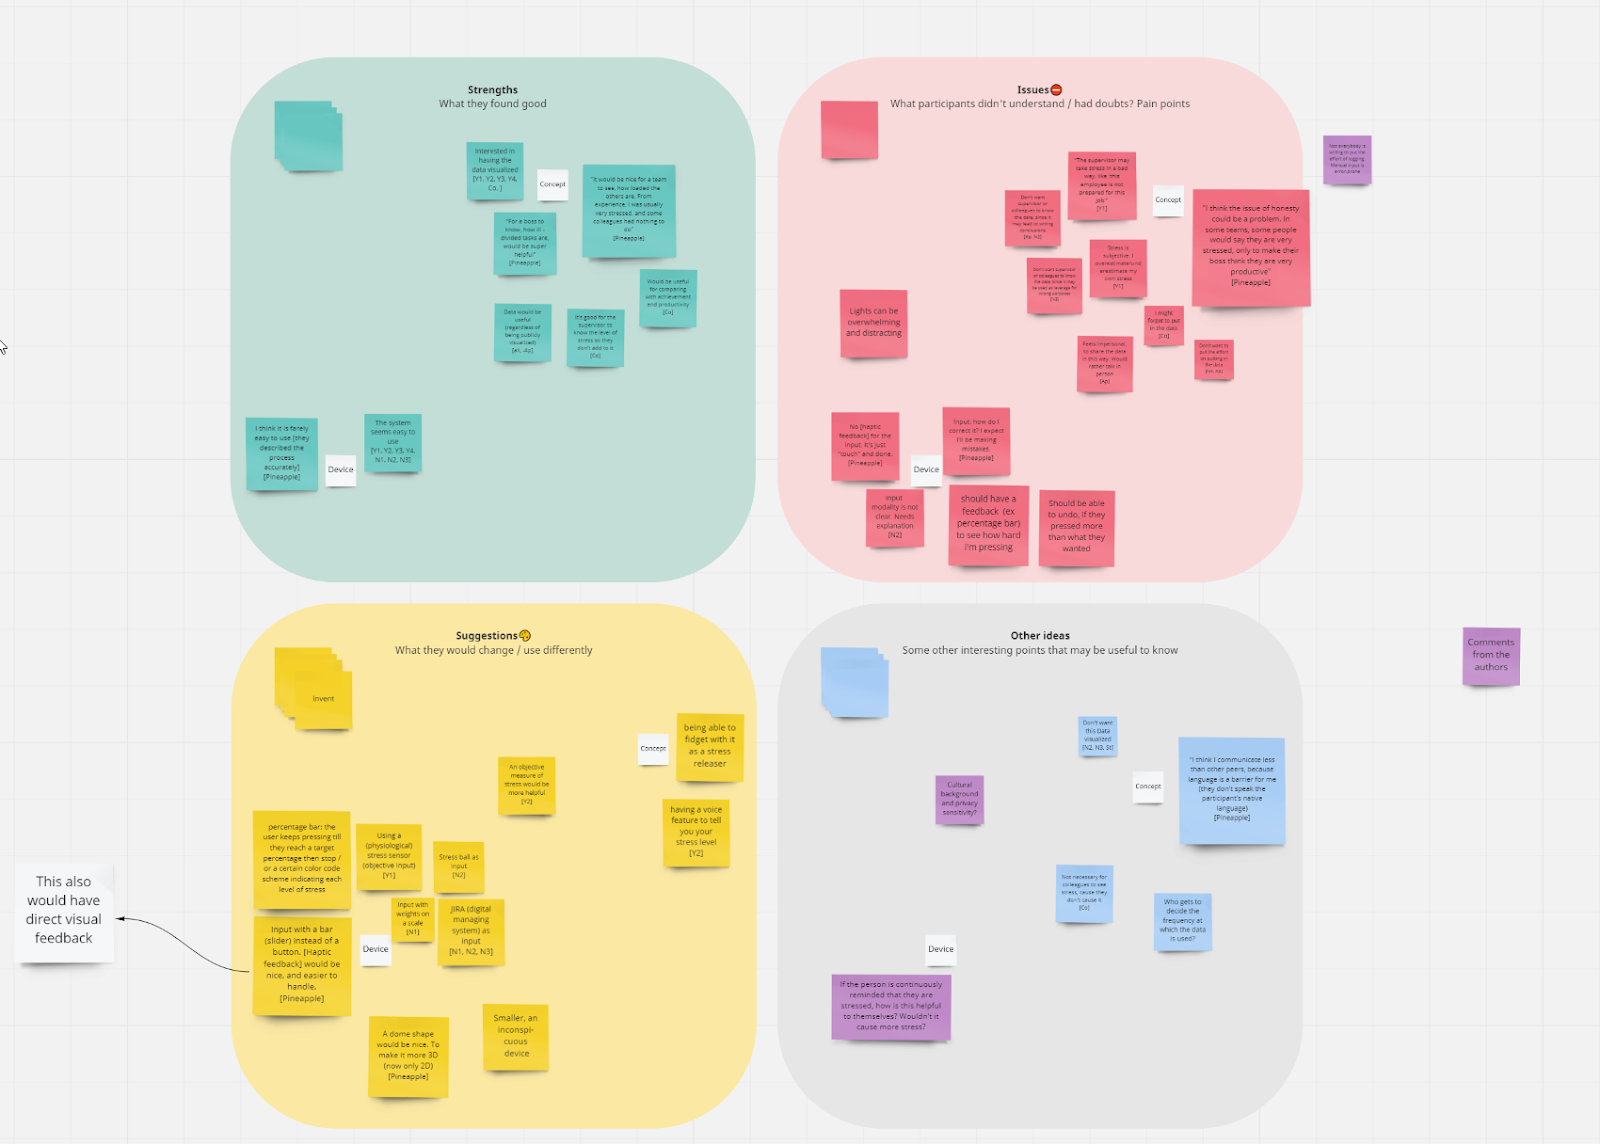
After conducting eleven interviews with eleven different participants, we divided the feedback into four categories: Strengths, Issues, Suggestions, and Other ideas, to help us understand and categorize the common issues (whether it’s a concept or a device issue) and add them to our future work.
Results & Analysis
As an overview, there were a few main issues that people were concerned about. Some people have privacy concerns; not everyone is open to sharing their data. Other issues were concerning the input. A more intuitive input (like pressing a stress ball), a more objective input (a stress sensor that makes the user self aware of their stress level), and an input that’s already connected to the user’s work tracking tools (Jira Kanban Board) is preferred. And in case of a subjective input, then an ‘undo’ option is a must, in case the user pressed too hard.